
NASA reveals how Arctic air froze half of America in January |
")
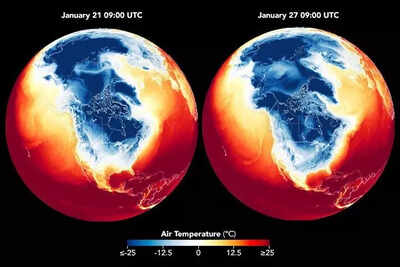
A big winter storm hit the US in late January and dumped snow and ice across a lot of states. After the storm passed, the cold didn’t leave. Instead, it stuck around for days and covered a huge area, especially places east of the Rocky Mountains.NASA has published an animation that is basically a moving map that shows how cold the air was each day. Dark blue means really cold. You can see temperatures rising a bit during the day and dropping at night, but overall the cold air spreads south and just hangs there instead of moving on.
NASA observations show arctic air spreading across the USA
Extremely cold air from northern Canada and even Siberia flowed into North America. High-pressure systems pushed the jet stream south, acting like a guide rail that dragged this freezing air deep into the US. This cold air also mixed with moist air, which is why the storm produced so much snow and ice from the Southwest all the way to New England.Some places saw record-breaking cold. In Nebraska, temperatures dropped to −26°F (−32°C). Parts of Texas, which usually don’t deal with this kind of weather, fell into the single digits. Even when temperatures started to rise slightly, the wind made it feel much colder, with wind chills as low as −20°F (−29°C) in the Midwest and Northeast.
NASA temperature maps show sustained cold
NASA tracked the event using blended from satellites and its GEOS global model. The maps show dark blue zones spreading south and east between January 21 and 29. These the coldest air near the surface. While the maps flickered with daily changes, the underlying signal remained steady. Cold air expanded, paused, and only gradually loosened its grip. The scale stood out, covering large parts of North America rather than isolated pockets.
NASA supports response and recovery efforts
NASA activated its Disasters Response Coordination System during the event. The agency provided maps and data through its open access portal to support emergency managers. These tools helped track conditions and plan response work. As forecasts pointed to further cold into early February, attention shifted to endurance rather than quick recovery. The weather eased in stages, unevenly, leaving some regions waiting longer than others.